

When I consider the equity markets from a macro perspective, I begin with the analysis of the price of the S&P 500. Then I use breadth indicators to confirm what I’m seeing by analyzing price action. Finally, and still very importantly, I look at market sentiment indicators that speak to how investors are feeling about the markets at any given moment.
While we’ve experienced a significant rally off the early April lows, my review of key sentiment indicators will show that there is definitely not rampant optimism these days. To the contrary, most signals appear to be similar to early-stage bearish phases. Let’s review the evidence together.
AAII Survey Shows Notable Lack of Bulls
The American Association of Individual Investors (AAII) conducts a weekly survey of members, asking if they are bullish, bearish, or neutral about equities. The latest weekly data from this poll shows 22% bullish and 56% bearish, with a 34% spread between the two buckets.
In the weeks following the February 2024 market peak, the AAII bullish reading plunged from about 45% to 20% and has remained around that level ever since. Bearish readings have been in the 55-60% range during the last eight weeks, and the spread between bulls and bears has been fairly consistent.
Despite many calls for optimism on the recent bounce in our major equity benchmarks, the AAII survey is suggesting that individual investors remain quite skeptical about further upside at this point. And if you look back to 2022, you’ll see that this survey can remain in this general range for quite some time during protracted bear phases.
NAAIM Exposure Index Indicates Defensive Positioning
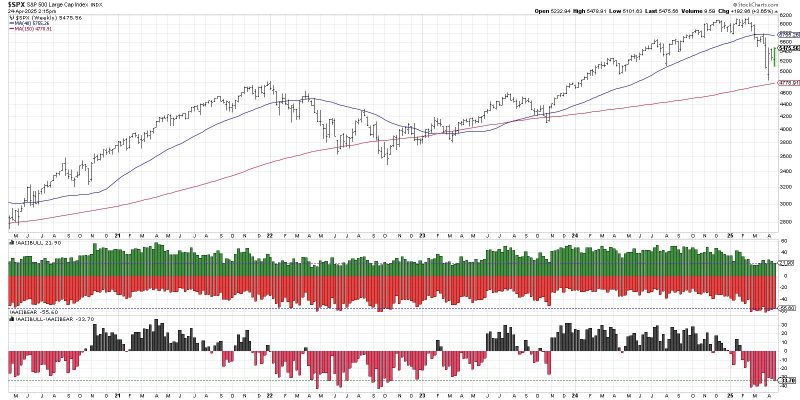
Now let’s look at two more sentiment indicators, starting with the NAAIM Exposure Index. As I discussed in a recent podcast interview with the President of NAAIM, the National Association of Active Investment Managers, this is an organization of money managers who are asked about their exposure to the equity markets every week.
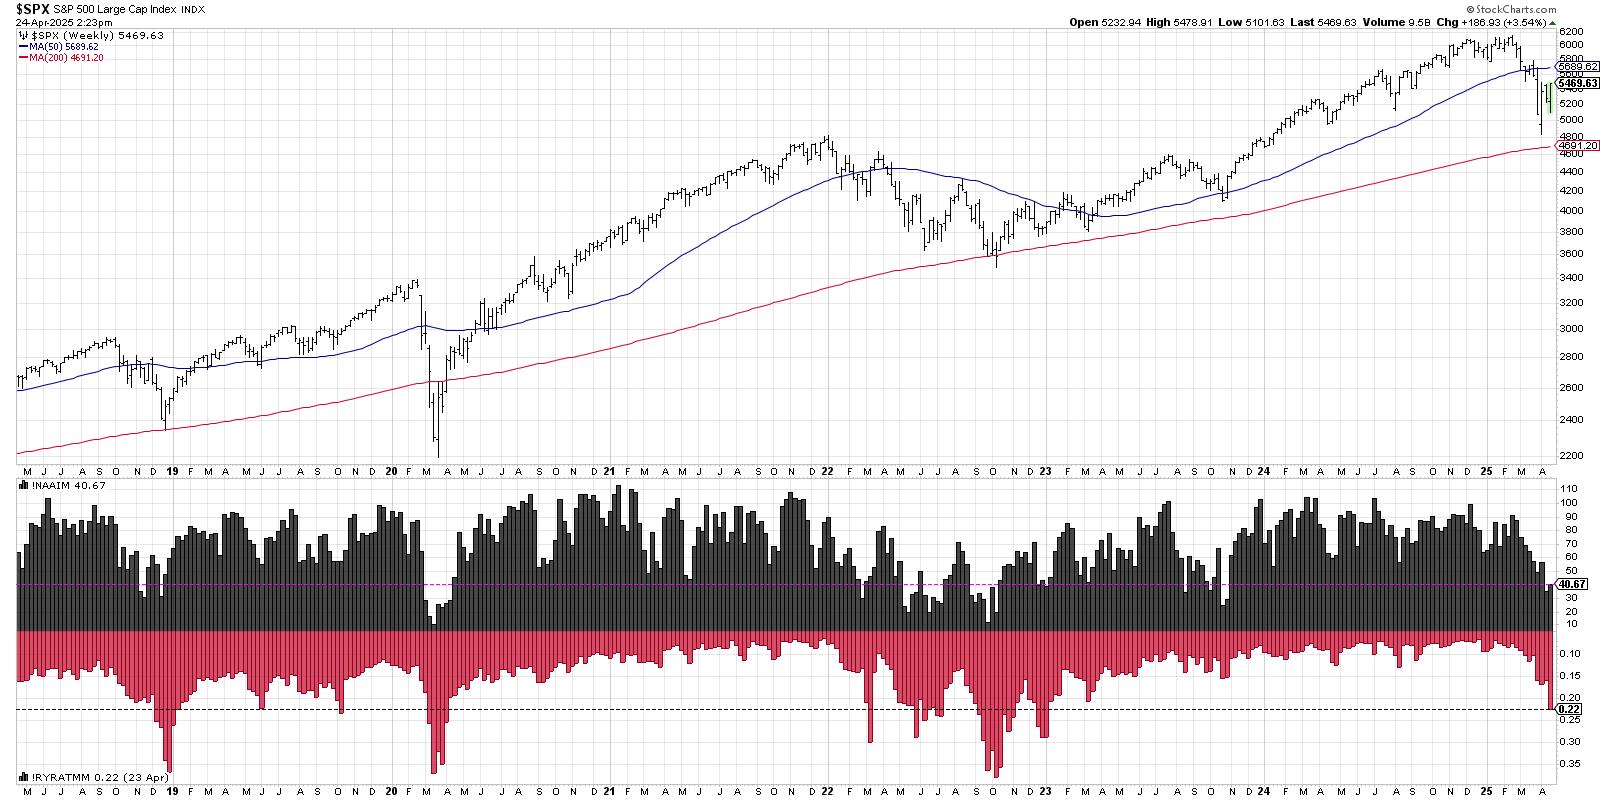
The latest results of that survey show an average allocation around 41%, down from just over 90% at the February market peak. So while I’ve heard rumblings of institutional investors piling into risk assets off the April low, this survey would suggest that there is still plenty of capital patiently waiting on the sidelines. And while the current reading at 41% is well below average, we’ve seen the indicator reach down to single digits during previous bear market cycles.
Rydex Flows Not Yet at Extreme Levels
The bottom panel in that previous chart shows the Rydex fund flows, showing how investors in the Rydex fund family are rotating between offensive and defensive positioning. This week, we observed a new log for 2025, showing the Rydex fund investors have continued to rotate to more defensive positions off the February market high. Look further to the left and you’ll see that in 2022, 2020, and late 2018, this indicator reached much deeper levels before a major market bottom was finally achieved. So while the recent rotation confirms a more cautious outlook for investors, it has not yet reached extreme enough readings to be giving a clear signal of downside capitulation.
In the order of importance, I would put price at the top of the list. Should the S&P 500 regains its 200-day moving average, I will find it much more difficult to remain bearish about market conditions. But based on my latest analysis of key market sentiment indicators, the bears may have more time in the sun before this pullback phase is over.
RR#6,
Dave
P.S. Ready to upgrade your investment process? Check out my free behavioral investing course!
David Keller, CMT
President and Chief Strategist
Sierra Alpha Research LLC
Disclaimer: This blog is for educational purposes only and should not be construed as financial advice. The ideas and strategies should never be used without first assessing your own personal and financial situation, or without consulting a financial professional.
The author does not have a position in mentioned securities at the time of publication. Any opinions expressed herein are solely those of the author and do not in any way represent the views or opinions of any other person or entity.